Author Archives: Arcadius Ahouansou

  • -

Why Enterprise Search is critical to the success of your business

Given that every single second, google search engine performs 400,000 queries, we all know how important search is in our daily life.

Talking about business, let’s take the example of a Bank, an e-commerce shop, a high-street retailer or an energy company. They all need a system that allows:

  • their potential customers to quickly and easily find the product they are looking for
  • their existing customers or employees to find help, support and advice.
  • their employees and partners to easily find project and products documentations such as PDF files, MS Word documents, Spread Sheets, shared documents across the company network, documents from the company CMS, CRM, … and the list goes on and on…


And failure to have such a system does cause a lot of loss to those compaines

Just imagine a home owner trying to re-mortgage his house for the very first time.
He goes to his bank web site and searches for the keyword “renew my mortgage”.
He gets back result pages like:

  • “Applying for a mortgage”,
  • “My Mortgage”
  • “Expired credit card”
  • etc…

He gets all sort of results except what he is really looking for.

But when he searches for the word “remortgage”, then he get the right answer.

This is very frustrating and a proper Search implementation would have helped both the customer and the Bank.

The same goes for a search for “Red shirt” where you get back most products from a brand called “Red Foo”.
There are many example where businesses are loosing customers just because they do not have the right technology.

At Menelic, we are specialized in Enterprise Search…
And we strongly believe that every single organization, every single business and every enterprise needs a proper search solution.

At Menelic, we go into extra length to make sure your clients, potential customers and employees get the right result whenever they perform a search.
Most importantly, we spend a lot more time on the top search terms, making sure they always get the get the right hit.

To find out how we can help you, please contact us.


  • -

Java REST API Benchmark: Tomcat vs Jetty vs Grizzly vs Undertow, Round 3

Too many things have changed since round 2

From Apache Bench to Gatling

The ApacheBench software I initially used for round 1 and round 2 is very good to get started with.
But there are better tools that allow to have more detailed reports and insight into the load test.
Another strong reason was that ApacheBench only support HTTP/1.0. The lack of support for HTTP/1.1 may have a negative impact on performance.
Switching to Gatling gave me more flexibility and also allowed to generate pretty graphs and more detailed statistics.
This will also allow anybody with Java installed to be able to run the tests without having to install any additional software.

HTTP Headers

One of the issues pointed out by Stuart in his comment is that the response header for each container was different.
Most importantly, Grizzly was sending the least header i.e Grizzly was transmitting less data than the other 3 containers and this certainly has an impact on performance and response time.
To address this, changes have been made so that every single container is returning the very same response header.
Since Grizzly by default would not allow to add the Server  HTTP header to the response, I had to implement a filter to allow for that header to be added to every response.

Now, all containers have the very same header which looks like this:

HTTP/1.1 200 OK
Server: TestServer
Content-Length: 27
Content-Type: application/json;charset=UTF-8
Date: Wed, 09 Mar 2016 18:57:19 GMT


On the other hand, with Gatling, I was also setting request headers like:

.acceptLanguageHeader("en-US,en;q=0.5")
.acceptEncodingHeader("gzip, deflate")
.userAgentHeader("Mozilla/5.0 (X11; Ubuntu; Linux x86_64; rv:44.0) Gecko/20100101 Firefox/44.0")
.acceptHeader("text/html,application/xhtml+xml,application/xml;q=0.9,*/*;q=0.8")
.connection("keep-alive")


Running the load test from a remote host

Another issue mentioned by Stuart is that ideally we want the HTTP containers being tested and the load generator to be on separate servers.
This has been addressed too.
This leads us to 2 machines in the very same Local Area Network.

HTTP containers are running on:

./sysinfo.sh
===CPU:
processor : 0
model name : Intel(R) Core(TM) i7-3537U CPU @ 2.00GHz
cpu cores : 2
processor : 1
model name : Intel(R) Core(TM) i7-3537U CPU @ 2.00GHz
cpu cores : 2
processor : 2
model name : Intel(R) Core(TM) i7-3537U CPU @ 2.00GHz
cpu cores : 2
processor : 3
model name : Intel(R) Core(TM) i7-3537U CPU @ 2.00GHz
cpu cores : 2

===RAM:
total used free shared buffers cached
Mem: 7.7G 3.0G 4.6G 323M 123M 1.4G
-/+ buffers/cache: 1.5G 6.2G
Swap: 7.9G 0B 7.9G
===Java version:
java version "1.8.0_72"
Java(TM) SE Runtime Environment (build 1.8.0_72-b15)
Java HotSpot(TM) 64-Bit Server VM (build 25.72-b15, mixed mode)

===OS:
Linux Ubuntu SMP Wed Jan 20 13:37:48 UTC 2016 x86_64 x86_64 x86_64 GNU/Linux


Gatling the load generator is runnig on

./sysinfo.sh 
===CPU:
processor	: 0
model name	: Intel(R) Core(TM) i5-5250U CPU @ 1.60GHz
cpu cores	: 2
processor	: 1
model name	: Intel(R) Core(TM) i5-5250U CPU @ 1.60GHz
cpu cores	: 2
processor	: 2
model name	: Intel(R) Core(TM) i5-5250U CPU @ 1.60GHz
cpu cores	: 2
processor	: 3
model name	: Intel(R) Core(TM) i5-5250U CPU @ 1.60GHz
cpu cores	: 2
 
===RAM: 
             total       used       free     shared    buffers     cached
Mem:           15G       1.7G        13G       367M        38M       928M
-/+ buffers/cache:       815M        14G
Swap:          15G         0B        15G
===Java version: 
java version "1.8.0_74"
Java(TM) SE Runtime Environment (build 1.8.0_74-b02)
Java HotSpot(TM) 64-Bit Server VM (build 25.74-b02, mixed mode)
 
===OS: 
Linux Ubuntu SMP Tue Sep 1 09:32:55 UTC 2015 x86_64 x86_64 x86_64 GNU/Linux


Proper warm-up

In round 1 and round 2, I was warming up the HTTP containers with a single HTTP GET request.
As suggested by Stuart, I am now doing a full 10 minute warm-up before running the real load test for 15 minutes.

Running the tests

–  One need to first start the HTTP server . This can be done by following the commands on the GitHub REST-API project page

–  Run Gatling: Please see the Gitub Gatling Page


The results

Compared to previous rounds, this one has shown unexpected results

The through output:

As show on the graph, Grizzly has shown the best through output, followed by Undertow.
More detail about the bench
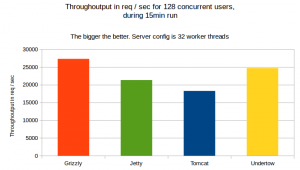
throughoutput-15min-run-32-workers-128-user

Throughoutput for a 15min run with 10min warmup and 128 concurrent users for 32 worker threads


The response time

Here, we have Undertow leading in term of response time for 99% of requests.
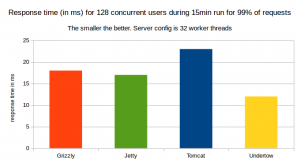
99% of Response time in ms for 128 concurrent users for a 15minute run
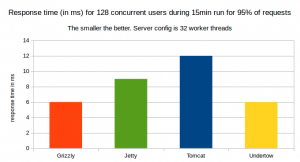
 

95% of Response time in ms for 128 concurrent users for a 15minute run

95% of Response time in ms for 128 concurrent users for a 15minute run

– When we consider 95% of responses, Undertow and Grizzly both have same 6ms response time
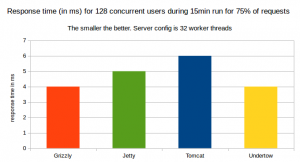
 

75% of Response time in ms for 128 concurrent users for a 15minute run

75% of Response time in ms for 128 concurrent users for a 15minute run

– When we consider 75% of response, Undertow and grizzly both have the same 4ms response time

Undertow and Grizzly have very similar performance here.

For more detail, please see the links in the resource section

Note that Grizzly remains a very interesting beast.
For instance the detailed response time of grizzly is depicted on the following graph:
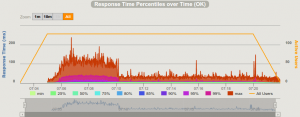
grizzly-response-time-in-round-03Despite the 10 minute warm-up, the response time was still high during the first 6 minutes of the load test, then response time suddenly dropped down from above 100ms to under 30ms and remained lower… Just as if Grizzly has an internal cache.
No other container has shown such a behaviour.


Conclusion

The changes such as

– same request and response headers (Yes, size does matter here… all containers need to be returning the very same header size),
– HTTP/1.1
– proper warm-up phase, and
– running load test from remote host

have shown totally different results from what we got in round 1 and round 2.

As shown in previous tests, Grizzly seems to perform best but here, we have learnt that Undertow can come very close.

Given that Undertow is a fully blown Servlet Container with support for the latest Servlet spec, JSP, JSF etc, it is an excellent choice for complex web applications.

Resources:

More detail about the load test reports can be found at

– http://arcadius.github.io/java-rest-api-web-container-benchmark/results/round-03/grizzly/

– http://arcadius.github.io/java-rest-api-web-container-benchmark/results/round-03/jetty/

– http://arcadius.github.io/java-rest-api-web-container-benchmark/results/round-03/tomcat/

– http://arcadius.github.io/java-rest-api-web-container-benchmark/results/round-03/undertow/


  • -

Java REST API Benchmark: Tomcat vs Jetty vs Grizzly vs Undertow, Round 2

This is a follow-up to the initial REST/JAX-RS benchmark comparing Tomcat, Jetty, Grizzly and Undertow.

In the previous round where default server configuration was used, the race was led by Grizzly, followed by Jetty, Undertow and finally Tomcat.

In this round, I have set the maximum worker thread pool size to 250 for all 4 containers.

To make this happen, I had to do some code changes for Jetty as well as Grizzly as this was not possible in the original benchmark.

This allowed me to start the container with the thread pool size as a command line parameter.

For more detail about running the tests yourself, please have a look at the github link in the resources section.

Note that here, the test have been run only for 128 concurrent users as from the previous round, the number of concurrent users did not make a big impact

System information


./sysinfo.sh 
CPU:
model name	: Intel(R) Core(TM) i7-3537U CPU @ 2.00GHz
 
RAM: 
             total       used       free     shared    buffers     cached
Mem:          7.7G       2.5G       5.1G       267M       114M       1.1G
-/+ buffers/cache:       1.4G       6.3G
Swap:         7.9G       280K       7.9G
Java version: 
java version "1.8.0_66"
Java(TM) SE Runtime Environment (build 1.8.0_66-b17)
Java HotSpot(TM) 64-Bit Server VM (build 25.66-b17, mixed mode)
 
OS: 
Linux arcad-idea 3.16.0-57-generic #77~14.04.1-Ubuntu SMP Thu Dec 17 23:20:00 UTC 2015 x86_64 x86_64 x86_64 GNU/Linux

Note that here, we have more free ram than in the previous round as I have shut down all running applications.

I also restarted the machine before every single test run

Results


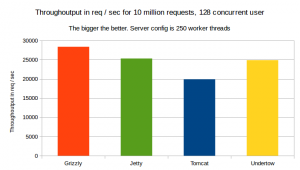
throughoutput-10-million-request-128-user-250-worker-threads

Through output for 10 million request, 128 concurrent users, 250 server worker thread

As shown on the graph above, as fas as tough output is concerned, again, Grizzly is far ahead leading the race, followed by Jetty.

Undertow came third very close to Jetty. Then Tomcat came last.


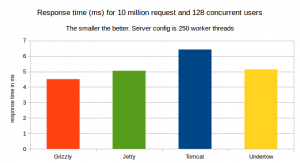
response-time-10-million-request-128-user-250-worker-threads

Response time for 10 million requests, 128 concurrent users, 250 server worker thread

The Response time graph above shows Grizzly ahead in the game, followed by Jetty, Undertow and Tomcat last

Conclusion

I expected Undertow to be the fastest of all. But somehow, this did not happen

The result of this round 2 is very similar to what we have seen in round 1: Grizzly is the fastest container when it comes to serving JAX-RS requests.

Resources

Source code and detailed benchmark results are available at https://github.com/arcadius/java-rest-api-web-container-benchmark


  • -

Java REST API Benchmark: Tomcat vs Jetty vs Grizzly vs Undertow

This is early 2016 and over and over again the question arises as to what Java web container to use, especially with the rise of micro-services where containers are  being embedded into the application.

Recently, we have been facing the very same question. Should we go with:

  1. Jetty, well known for its performance, speed and stability?
  2. Grizzly, which is embedded by default into Jersey?
  3. Tomcat, the de-facto standard web container?
  4. Undertow, the new kid in the block, prised for it’s simplicity, modularity and performance?

Our use case is mainly about delivering Java REST APIs using JAX-RS.
Since we were already using Spring, we were also looking into leverage frameworks such as Spring Boot.

Spring boot out of the box supports Tomcat, Jetty and Undertow.

This post discusses about which web container to use when it comes to delivering fast, reliable and highly available JAX-RS REST API.

For this article, Jersey is being used as the implementation.
We are comparing 4 of the most popular containers:

  1. Tomcat(8.0.30),
  2. Jetty(9.2.14),
  3. Grizzly(2.22.1) and
  4. Undertow(1.3.10.FINAL).

The implemented API is returning a very simple constant Json response …. no extra processing involved.

public class ApiResource {
    public static final String RESPONSE = "{\"greeting\":\"Hello World!\"}";
    @GET
    public Response test() {
        return ok(RESPONSE).build();
    }
}

The code has been kept deliberately very simple. The very same API code is executed on all containers.

For more detail about the code, please look at the link in the resource section.
We ran the load test using ApacheBench with concurrency level=1, 4, 16, 64 and 128
the results in term of fastest or slowest container does not change no matter the concurrency level
so, here, I am publishing only concurrent users=1 and concurrent users=128

System Specification

This benchmark has been executed on my laptop:

CPU:
model name	: Intel(R) Core(TM) i7-3537U CPU @ 2.00GHz
 
RAM: 
             total       used       free     shared    buffers     cached
Mem:          7.7G       4.9G       2.7G       399M       206M       2.3G
-/+ buffers/cache:       2.5G       5.2G
Swap:         7.9G         0B       7.9G
Java version:
java version "1.8.0_66"
Java(TM) SE Runtime Environment (build 1.8.0_66-b17)
Java HotSpot(TM) 64-Bit Server VM (build 25.66-b17, mixed mode)
 
OS: 
Linux arcad-idea 3.16.0-57-generic #77~14.04.1-Ubuntu SMP Thu Dec 17 23:20:00 UTC 2015 x86_64 x86_64 x86_64 GNU/Linux


Concurrent number of Users = 1

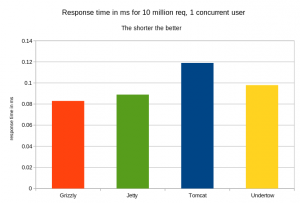
response-time-10-million-request-1-user

Response Time for 10 million requests for 1 concurrent user

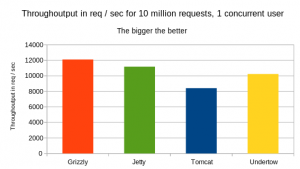
throughoutput-10-million-request-1-user

Through-output for 10 million requests for 1 concurrent user


from the 2 graphs above, Grizzly is leading the benchmark followed by Jetty, followed by Undertow. Tomcat remains the last in this benchmark

Concurrent number of Users = 128


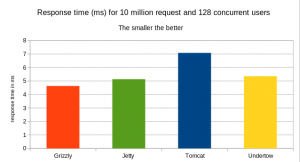
response-time-10-million-request-128-user

Response Time for 10 million requests and 128 concurrent users

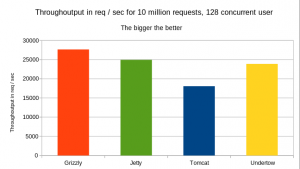
throughoutput-10-million-request-128-user

Through-output for 10 millions requests and 128 concurrent users

Note that Grizzly is still leading here and that concurrency level =128 did not change anything to which server is best or worst.

Note that we have also tested for concurrency level =4, 16 and  64 and the final result is pretty much the same

Conclusion

For this benchmark, a very simple Jersey REST API implementation is being used.

Grizzly seems to give us the very best through-output and response time no matter the concurrency level.

in this test, I have been using the default web container settings.
And as we all know, no one put a container into production with its default settings.

in the next blog post, I will change the server configuration and rerun the very same tests

Resources

The source code is available on GitHub


  • -

ZooKeeper: shutdown Leader! reason: Not sufficient followers synced, only synced with sids

We have been running this cross DC SolrCloud cluster for over a year now and things have been working well for us.

A couple of weeks ago, In one of our non production environment, our monitoring system went mad as our ZooKeeper quorum shot itself down, leaving our SolrCloud cluster in a read-only state.zookeeper_logo

The network seemed OK and no other system was affected.

However this was a non-production system, we spent some time investigating the issue by looking in the log and the system configuration files.

The ZooKeeper Leader

The log file on the ZooKeeper leader  node showed that at the the time of the incident, we had:

[QuorumPeer[myid=K]/0.0.0.0:2181:Leader@493] - Shutting down
[myid:K] - INFO  [QuorumPeer[myid=4]/0.0.0.0:2181:Leader@499] - Shutdown called
java.lang.Exception: shutdown Leader! reason: Not sufficient followers synced, only synced with sids: [ K ]
at org.apache.zookeeper.server.quorum.Leader.shutdown(Leader.java:499)
at org.apache.zookeeper.server.quorum.Leader.lead(Leader.java:474)
at org.apache.zookeeper.server.quorum.QuorumPeer.run(QuorumPeer.java:799)

The above log entries revealed that in the allocated time (time-out T), no follower was able to sync data from the leader ZK node with myid K.
The leader (with id K not) having enough follower to maintain the quorum of 5, deliberately shot itself down.

The ZooKeeper Followers

The log entries on the followers are identical go as follow:

[myid:L] - WARN  [QuorumPeer[myid=1]/0.0.0.0:2181:Follower@89] - Exception when following the leader
java.net.SocketTimeoutException: Read timed out
at java.net.SocketInputStream.socketRead0(Native Method)
at java.net.SocketInputStream.read(SocketInputStream.java:152)
at java.net.SocketInputStream.read(SocketInputStream.java:122)
at java.io.BufferedInputStream.fill(BufferedInputStream.java:235)
at java.io.BufferedInputStream.read(BufferedInputStream.java:254)
at java.io.DataInputStream.readInt(DataInputStream.java:387)
at org.apache.jute.BinaryInputArchive.readInt(BinaryInputArchive.java:63)
at org.apache.zookeeper.server.quorum.QuorumPacket.deserialize(QuorumPacket.java:83)
at org.apache.jute.BinaryInputArchive.readRecord(BinaryInputArchive.java:103)
at org.apache.zookeeper.server.quorum.Learner.readPacket(Learner.java:153)
at org.apache.zookeeper.server.quorum.Follower.followLeader(Follower.java:85)
at org.apache.zookeeper.server.quorum.QuorumPeer.run(QuorumPeer.java:786)
[myid:L] - INFO  [QuorumPeer[myid=1]/0.0.0.0:2181:Follower@166] - shutdown called
java.lang.Exception: shutdown Follower
at org.apache.zookeeper.server.quorum.Follower.shutdown(Follower.java:166)

From the above entries, we can deduce that the followers were trying to sync data from the leaders at the same time and they threw java.net.SocketTimeoutException: Read timed out  during the allocated  time-out T

The ZooKeeper config

Now, looking at our configuration, we have among others the following lines:

tickTime=2000
initLimit=5
syncLimit=2

This means that the time-out T I was referring to in this blog is defined as

T = 2000*2= 4000ms = 4 sec

4 sec is definitely not enough for syncing SolrCloud config files data across multiple DCs.
The ZK configuration was clearly a default value that originally came with ZK and was never changed to reflect our deployment configuration


The fix

We changed the config to the one below

tickTime=4000
initLimit=30
syncLimit=15

Now, we are giving 60sec to each ZK follower node to sync data with the leader.

Other recommendations

– I would strongly recommend to read the ZooKeeper manual and understand the meaning of configuration options such as tickTime ,initLimit  and syncLimit  and check your ZK config files to make sure they are correct

– If your ZooKeeper server does not have an IPv6 address, make sure you add

-Djava.net.preferIPv4Stack=true

to your ZK start-up script. This will help avoid all sort of leader election issues (see [3] in the resources section below).

– By default, the RAM used by ZK depends on the one available the system. It’s recommended to explicitly allocate the heap size that ZK should use. This can be done by adding the following line into conf/java.env :

export JVMFLAGS="-Xms2g -Xmx2g"

You may want to change 2g to fit your need.

– It is a good idea to leave enough RAM for the OS and monitor the ZK node to make it NEVER swap!

Resources

  1. https://zookeeper.apache.org/doc/trunk/zookeeperAdmin.html#sc_configuration
  2. https://zookeeper.apache.org/doc/trunk/zookeeperAdmin.html#sc_bestPractices
  3. http://lucene.472066.n3.nabble.com/Zookeeper-Quorum-leader-election-td4227130.html
  4. https://mail-archives.apache.org/mod_mbox/zookeeper-user/201505.mbox/%3CCANLc_9+5c-4eqGNx_mbXOH3MViiuBVbMLNPP3xhafQA2xQ=POg@mail.gmail.com%3E
  5. http://www.markround.com/ ( Thanks for figuring out the IPv6 issue )


  • -

Allowing SolrJ CloudSolrClient to have preferred replica for query operations

In the previous blog post,solr-logo-on-orange-150

I discussed about how HTTP compression helped us improve solr response time and reduce network traffic in our cross DC solrCloud deployment.

In our deployment model, we have only 1 shard per collection and in term of content, all SolrCloud nodes are identical.

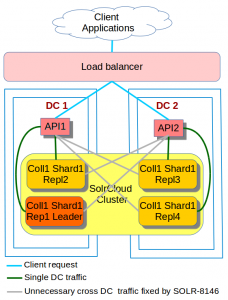
API and SolrCloud Traffic across two DCs

API and SolrCloud Traffic across two DCs

Let’s assume that:

  1. a request comes from the load balancer and lands on API1 in DC1,
  2. then API1 queries Solr Repl4 which is in DC2
  3. Response travels from DC2 back to API1 in DC1,
  4. the API1 finally sends response back to the client.

As stated earlier, all SolrCloud nodes have the very same content and are just replica of the same collection.

The question is: why should API1 go all the way to repl4 in DC2 to fetch data that is also available in repl1 and repl2 in DC1? There is certainly a better way.

To address this, we are proposing SOLR-8146 to the community

How it works

  1. Internally, the SolrJ client queries Zookeeper to find out the live replica of the collection being queried.
  2. SolrJ also acts as a load balancer. So, before querying Solr, SolrJ shuffles the list of replica URLs, and the first at the top of the list is used for querying. The second one is use only if the first one fails
  3. after the list is shuffled, we check whether the current request is a query operation or not
  4. If it’s a query operation, only then SOLR-8146 is applied by moving to the top of the list those URLs matching the specified Java Regular Expression . The pattern could be for instance an IP address or a port number etc.  I would recommend you check the tests in the source code of the patch at SOLR-8146

Notes

  1.  SOLR-8146 only deals with read or query operations. Any admin or update or delete operation will not be affected by the patch.
  2.  SOLR-8146 changes only the SolrJ client behaviour
  3.  SOLR-8146 comes into play if and only if the system property solr.preferredQueryNodePattern is set either by using the standard java -D  command line switch or in java  code System.setProperty()
  4. SOLR-8146 will still work no matter the number of collections deployed
  5. SOLR-8146 will still work no matter the number of shards deployed
  6. SOLR-8146 does not add to or remove nodes from the list of live solr nodes to query. it just re-order the list so that the one matching the specified pattern are first to be picked.
  7. One does not have to run SolrCloud across multiple DC in order to take advantage of SOLR-8146. There are many other use cases such as
    1. one could have a cluster running across multiple racks and prefer to have client API from rack1 talk to solr servers on rack1 only
    2. In a SolrCloud cluster, one may want one of the nodes to be used for analytics and manual slow queries or batch processing. SOLR-8146 would help keep a specific node from SolrJ queries.
    3. etc

Conclusion

SOLR-8146  brings more flexibility to the ways the SolrJ load balancer selects the nodes to query. This has many use cases.

Hopefully, it will be useful to others too.


  • -

Deploying SolrCloud across multiple Data Centers (DC): Performance

After deploying our search platform across multiple DCs deployment, we load tested the Search API.

We were not too impressed by the initial result.

We had issues like:
– high response time,
– high network traffic,
– long running queries.

After investigation, it turned out that a large amount of search result was being transferred between the SolrCloud nodes and the search API.

This is because clients were requesting a large number of documents.
It turned out that this was a business requirement and we could not put a cap on this.

HTTP compression to the rescue

Solr supports HTTP compression. This support is provided by the underlying Jetty Servlet Container.

To enable HTTP compression for Solr, two steps are required:

  1. Server Configuration

    To configure Solr 5 for HTTP compression, one needs to edit the file
    server/contexts/solr-jetty-context.xml by adding before the closing </config> the following XML snippet:

    
            org.eclipse.jetty.servlets.GzipFilter
            /*


                mimetypes
                text/html,text/xml,text/plain,text/css,text/javascript,text/json,application/x-javascript,application/javascript,application/json,application/xml,application/xml+xhtml,image/svg+xml
            
            
                methods
                GET,POST


    The next step is to set the gzip header on the client.

  2. Client Configuration

    The SolrJ client needs to send the HTTP header Accept-Encoding: gzip, deflate to the server. Only then, will the server respond with compressed data.
    To achieve this, org.apache.solr.client.solrj.impl.HttpClientUtil utility class is being used:

    DefaultHttpClient httpClient = (DefaultHttpClient) cloudSolrClient.getLbClient().getHttpClient();
    HttpClientUtil.setAllowCompression(httpClient, true);
    HttpClientUtil.setMaxConnections(httpClient, maxTotalConnections);
    HttpClientUtil.setMaxConnectionsPerHost(httpClient, defaultMaxConnectionsPerRoute);
    HttpClientUtil.setSoTimeout(httpClient, readTimeout);
    HttpClientUtil.setConnectionTimeout(httpClient, connectTimeout);
    

    Note that in the code above we not only enable compression on the client, but we also set soTimeout and connectionTimeout on the client.

  3. The result

    1. Before enabling compression, we were doing in total in term of network traffic 12000KB/sec
    2. After changes, we dropped to 3000KB/s, that is serving just 25% of the original traffic, in other words, a drop of 75% of the network traffic!
    3. We have also seen a drop in response time by more than 60%!
    4. There is a price to pay for all of this: we have noticed a slight increase in CPU usage

Conclusion

However HTTP compression can be very beneficial when serving large response, it is not always the answer.
If possible, it’s better to serve small responses (for instance 10-40 items/pages).

In the next blog, I will share some of the challenges we have been facing.


  • -

Deploying SolrCloud across multiple Data Centers (DC)

Objectivessolr-logo-on-orange-150

Our objective is to deploy SolrCloud (5.X) across 2 DCs in active-active mode so that we still have all our search services available in the unfortunate event of a Data Centre loss.

Backgrounds

We used to run a Solr 3.x cluster in the traditional master-slave mode.
This worked very well for us for many years.
When Solr4 came out, we upgraded the cluster to the latest version of Solr, but still using the traditional master-slave architecture.

Why the move to SolrCloud?
There were many reasons behind this move. Below is a subset of them:

  1. The need for near real-time (NRT) search so that any update is immediately available to search,
  2. The ability to add more nodes to the cluster and scale as needed,
  3. The ability to deploy our search services in 2 DCs in active-active mode i.e. queries are simultaneously being served by both DCs,
  4. The ability to easily shard collections,
  5. The ability to avoid any single point of failure and make sure that the search platform is up and running in case one DC is lost.

The initial goal was to have our SolrCloud cluster deployed in 2 DCs meaning a ZooKeeper cluster spanning across 2 DCs.
As of the time of this writing, for Solr 5.3 and ZooKeeper 3.4.6 to work in a redundant manner across multiple DCs, we need 3 DCs, the 3rd DC being used solely for hosting one ZK node in order to maintain the quorum in case one DC is lost.

In summary, we have 3 private corporate DCs, connected with high speed gigabit fiber optic where the network latency is minimal.

Deployment

Note that we are well aware of the SOLR-6273 which is currently being implemented and the related blog entry at yonik.com .

We are also aware of SolrCloud HAFT

ZK Deployment:

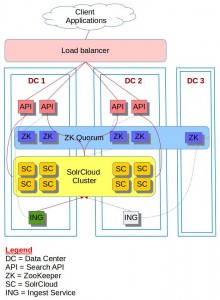
  1. DC1: 2 ZK nodes
  2. DC2: 2 ZK nodes
  3. DC3: 1 ZK node

This is a standard ZK deployment forming a quorum of 5 nodes, spanning across 3 DCs

SolrCloud deployment:

In total 8 SolrCloud nodes, 4 in each of the two DC. DC3 having no SolrCloud node

  1. DC1: 4 SolrCloud nodes
  2. DC2: 4 SolrCloud nodes
  3. DC3: 0 (no) SolrCloud

Ingest Services deployment

solr-cross-dc

Cross DC SolrCloud Deployment architecture

The Ingest Service used to push data through to the SolrCloud cluster.
It’s build using SolrJ, so it talks to the ZK cluster as well.

  1. DC1 : 1 Ingest Service
  2. DC2 : 1 Ingest Service
  3. DC3 : 0 Ingest Service

Note that the ingest Services run in a round-robin fashion and at a given moment, only one of them is actively ingesting. The other one would be in standby mode and will be activated only if it’s the first to “acquire the lock”.
So, data flows from the active Ingest Service to the SolrCloud leader of a given collection regardless of the location of the Leader.

Search API deployment:

  1. DC1 : 2 API nodes
  2. DC2 : 2 API nodes
  3. DC3 : 0 (no) API node

This is API is built using SolrJ and is used by many client applications to search and suggestions.

Important note

In this deployment model, the killer point here is DC connectivity latency.
If there is high latency between the 3 DCs, this will inevitably kill our ZK quorum.
In our specific case, all 3 DCs are UK based and have fat pipe connecting them together.

Conclusion

During this process, we have come across many issues that we have managed to overcome them.

In the next blog post, I will be sharing with you the challenges we faced and how we addressed them.

Resources

  1. ZooKeeper Internals
  2. Mailing list thread about SolrCloud across multiple DC
  3. Presentation about SolrCloud HAFT

  • -

Solr 5.0.0 released

Apache Solr 5.0.0

Solr 5.0.0 has been officially released on the 20th of February 2015

This is a major release and as such, there have been significant changes in Lucene and in Solr code base.
Here, I am going to discuss 3 of the changes:

  1. Solr 5 as a standalone server
    The most important change in my opinion is that from now on, Solr is a standalone server just like ElasticSearch, Cassandra or MongoDB .
    The distribution comes with a set of scripts in the bin/ directory to enable users to run solr without the need of installing a servlet container.

    $ tree bin/
    bin/
    ├── init.d
    │ └── solr
    ├── install_solr_service.sh
    ├── oom_solr.sh
    ├── post
    ├── solr
    ├── solr.cmd
    ├── solr.in.cmd
    ├── solr.in.sh
    └── solr-8983.port
    1 directory, 9 files

    And there is a lot of goodies in the bin/ directory such as:

    • bin/install_solr_service.sh
      can be used to install solr as a service on unix-like systems
    • There is now some default GC tuning parameters available in
      bin/solr.in.sh to help reduce the guesswork. Note that these could easily be overridden if needed.
    • There is also
      bin/oom_solr.sh
      that get executed automatically to kill solr in case the worse happens and Solr decides to drop its pant whith in OutOfMemoryError.
    • To see the available option for starting solr, just try
      bin/solr start –help
      You may also want to look at the downloaded documentation at docs/quickstart.html
    • For windows users, there are only
      solr.cmd
      meaning no automatic service installation at this moment for Windows.
      Note that there are many external tools allowing to deploy a .bat file as a service on windows
    • Note that as of Solr 5.0.0, under the hood, jetty is embedded into the distribution and there is still a solr.war file involved

      $ tree server/webapps/
      server/webapps/
      └── solr.war
      0 directories, 1 file

      This means that however this is not recommended, one would still be able to deploy Solr 5 into a custom servlet container if needed, using the provided solr.war
  2. Solrj: The Java Client
    For clients applications using SolrJ, the old abstract class SolrServer has been deprecated in favor of the new and shiny abstract class SolrClient, for obvious reasons.
    From now on, we should all be using implementations such as CloudSolrClient, ConcurrentUpdateSolrClient, HttpSolrClient or LBHttpSolrClient instead.
  3. Lucene core library
    There have been many important changes in the core library such as
    more robust index IO operation by moving to NIO.2 , reduced memory footprint and various other optimization.In addition LUCENE-6050 that we have been waiting for has finally been released. In other words, the Lucene AnalizingInfixSuggester now allows to specify whether a context should be applied as is a MUST or a SHOULD operation

Resources